Don't have time to read the whole article? Here's a summary:
- 10 close races that went the way of the BJP-AJSU alliance instead of JMM brought about the alliance’s majority (more here)
- Parties did very badly in retaining seats from the 2009 Jharkhand assembly polls, only 36% were retained by the same party (more here)
- JMM improved a lot in the state’s ST assembly seats, it actually doubled its total votes from 2009. (more here)
Now on to the good stuff. ;)
 You must be wondering, an article on the Jharkhand elections
now? One month after the results have been announced? I know, I know, it’s just
that I've had this dataset on the Jharkhand elections lying with me for a
while, and it’s hard for me to move on to anything else till I’ve analysed this
in some way!
You must be wondering, an article on the Jharkhand elections
now? One month after the results have been announced? I know, I know, it’s just
that I've had this dataset on the Jharkhand elections lying with me for a
while, and it’s hard for me to move on to anything else till I’ve analysed this
in some way!
One of the things I'm most interested in finding out was
which seats were the ones that decided the elections, if that's possible. Don't
know, guess I was doing it out of some journalistic need to reduce the election
results to “10 seats that made the difference".
I'll be going a little beyond which party won how many seats, but if you want to refresh your memory of what happened, you can look at the chart above, but like I said, I’ll be going a lot deeper.
Anyway, let's dive into the data and see if there are any trends/patterns worth pointing out.
I'll be going a little beyond which party won how many seats, but if you want to refresh your memory of what happened, you can look at the chart above, but like I said, I’ll be going a lot deeper.
Anyway, let's dive into the data and see if there are any trends/patterns worth pointing out.
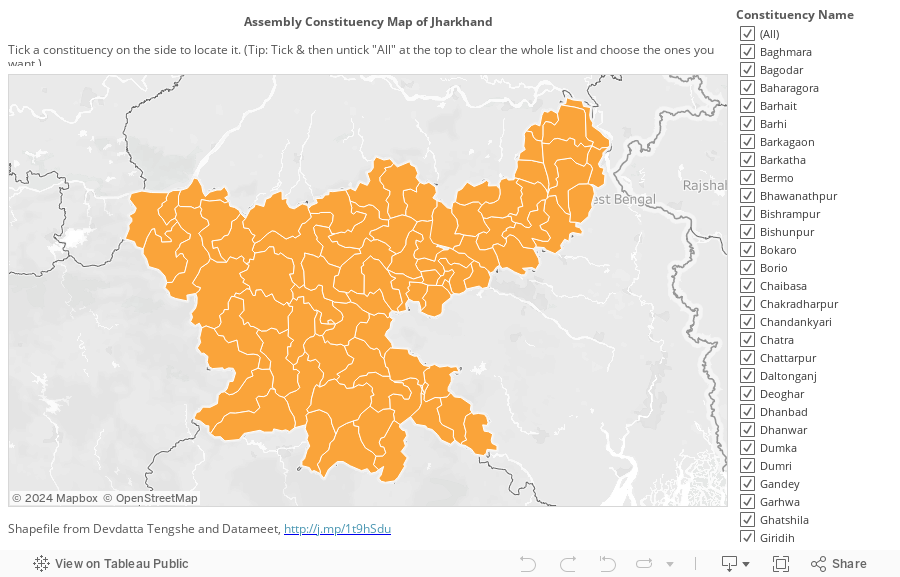
Guess I should probably start off with a constituency map of
Jharkhand, so that if I mention a constituency such as Lohardaga that you've
never heard of, you can at least geographically place it.
I guess the first thing you'd say is if the race for a
particular seat was close, that seat probably mattered more. In the sense that
it is a seat that could have gone to any of the competing parties, and the fact
that it went to, say the BJP, probably made a difference to the final outcome
of the elections.
Looking at all those seats that the BJP won in which the
margin of victory was less than 10k votes --14 seats--we get a possible idea of
the seats that made a difference. (I explain why I went for a figure of 10,000 votes—instead
of the more commonly used 5% vote share—in a section below titled "What counts as close?".)
If we look at the parties that were runners-up in those
seats and which could potentially have overtaken the BJP, Jharkhand Mukti
Morcha (JMM) were runners-up in nine of them, namely Rajmahal, Borio, Sisai,
Gumla, Dumka, Ghatshila, Potka, Madhupur, Giridih.
If we consider the BJP's alliance partner All-Jharkhand
Students Union (AJSU), of the five seats it won, two were won with margins less
than 10K votes, and in one of them—Tundi—the runner-up was JMM.

So if the BJP had lost those 9 seats and AJSU had lost Tundi
to the runners-up JMM, the BJP-AJSU alliance probably wouldn't have had the
majority it does now. The alliance would have gone down 10 seats from 42 at
present to 32. On the other hand, JMM would have gone up ten seats from 19 to
29 and become the single largest party with 1 seat more than the BJP's reduced
tally of 28.
So these seats, perhaps, didn't
decide whether the BJP-AJSU alliance won the elections or not, they would
still probably have won. But these 10 seats did
decide whether the alliance would get a majority. (Of course, in this
imaginary scenario, the Governor could have also invited the JMM first as the
single largest party to form the government instead of the BJP, but that’s
something we may never know!)
What would especially hurt JMM about this is that five of
those 10 seats (Borio, Tundi, Dumka, Ghatshila, Madhupur) were ones that it had
won in 2009.
The BJP though was no better than the JMM in retaining seats that were won in 2009. Each of those parties retained only 10 of the 18 seats they won last time.

Here's a look at each party’s seats in 2014 with a colour
legend to show which party had won those respective seats in 2009.
The Congress (I) retained just one of the 14 seats it won
last time (Barkagaon) and JVM retained only two of the 11 seats it won in 2009
(Simaria, Poreyahat).
JVM’s figure could have been more but for the fact that four JVM MLAs joined the BJP in the interim and retained the seats they won in 2009 under the BJP’s banner. (1-Dulo Mahato in Baghmara, 2-Satyendra Nath Tiwari in Garhwa, 3-Nirbhay Kumar Shahabadi in Giridih, 4-Phul Chand Mandal in Sindri)
JVM’s figure could have been more but for the fact that four JVM MLAs joined the BJP in the interim and retained the seats they won in 2009 under the BJP’s banner. (1-Dulo Mahato in Baghmara, 2-Satyendra Nath Tiwari in Garhwa, 3-Nirbhay Kumar Shahabadi in Giridih, 4-Phul Chand Mandal in Sindri)
I haven’t checked the all-India or historic figures for whether
an incumbent party or candidate is favoured or not, so in that context, I can’t
really say whether poor seat retention in Jharkhand should be that much of a surprise
to us or not.
28 of the 81 legislative seats in Jharkhand, around 35%, are
reserved for ST candidates, which is the largest percentage of assembly seats
reserved for ST candidates outside the North-east. So given how important they
are, I wanted to see how the parties performed specifically in these ST seats.

The BJP got 11 seats in 2014 (5 retained from 2009) while JMM got 13 seats (7 retained from last time.) And if we look at the vote share just in ST seats, BJP's share of the votes was 30.1%, with the JMM just ahead at 30.2%

(Of course, getting 30 % of the vote share in these ST seats
doesn’t mean that they got 30 % of the tribal vote, however tempting that interpretation
might be. There may be non-tribals living in these ST seats who are included among
the voters as well as tribals living in non-ST reserved seats who aren’t
included.)
The 30% figure represents a 6 percentage point increase in
vote share for the BJP from 2009 and a 11 percentage point increase for the
JMM.
And if we look at actual votes, those for JMM more than doubled
from 2009 growing by around 110%, while BJP's votes increased by 65%. The sob
story for the Congress(I) continued with its vote share in ST seats dropping 7
percentage points and its actual votes dropping 23%.
SMALLER PARTY STRONGHOLDS

Whether that's due to the party or the candidate having a stronghold there, I don’t know, that’s something only a field reporter or an expert with a better knowledge of Jharkhand will be able to say.
(Note: The following two sections aren’t really a part of the article, so you can stop here if you want but you’re welcome to read them and get to know why I made some of the choices I did in the write-up above.)
So how do we decide if a race is close? A contest where if conditions were slightly different, the result would have easily gone the other way? The point beyond which a strategist in a party’s Ranchi headquarters starts thinking to himself, "That seat’s gone, we shouldn’t have any regrets, we couldn't have done any better. Closing that margin would have needed too much manpower or resources to have been worth it."
Indiavotes,
the election website from Niticentral has defined it as any contest where the
victory margin was less than 5% of the vote share. The thing though is that
given the different turnouts in various constituencies, a 5% vote share in
terms of actual votes could mean anything from 5,200 votes in Torpa to 13,000
in Bokaro and I wasn't very happy with that much variation.
I then decided to define closeness in terms of actual vote
margin instead of vote-share margin. Let me explain why. Imagine that there are
two seats, A & B, that were decided by margins of 10,000 votes, and the
number of people who voted in total (ie. turnout) was 250,000 in A and 500,000
in B. If you're this party strategist in the Ranchi headquarters, would you
think that because 10,000 votes in B is a smaller vote share margin, that the
race in B isn’t as close as that in A?
Never really met any strategists, but I would imagine that
their response would be that the races in A & B were equally close, and that both those seats were equally gettable. Meaning that the resources and manpower the party
would have to expend in changing the minds of those 10,000 voters in those two
seats, in closing that 10,000 vote gap for the next elections, would be the
same in A & B. A victory margin of 10,000 votes wouldn't mean that it was a
closer race in A than in B just because B had a larger turnout.
But it seems the 5% vote share margin is used by a lot of experts,
however much I doubt its usefulness, so I decided to give it partial
recognition by going for a figure of 10,000 which is close to 5% of the total
votes cast in some of the larger turnouts in Jharkhand. I then followed the
logic that if you’re allowing for the margin of closeness to be 10K votes in
constituencies with larger turnouts, you should allow for 10K votes in
constituencies with smaller turnouts too.
There’s probably a more statistically-rigorous and
scientifically-valid way to go about this. If we get down to it, closeness
probably even varies from constituency to constituency. So if you're a social
scientist and know of a better way to define closeness, do get in touch! I’ll
be surprised if someone hasn’t already come up with some formula that takes
into account the number of candidates in a constituency, votes polled for each
etc. etc. But given the readership I expect for this article, a figure of 10K
should be fine.
A look at the histogram or distribution of victory margins will show you how 33 of
the 81 seats will be classified as close if we go with the 10,000 vote definition.
HOW THE "CLOSE" SEATS COULD HAVE GONE
Taking the idea further that a victory margin of 10,000
seats counts as close, I had a look at those seats where parties were within
10,000 seats of victory. The way I worked this, these figures would include
seats not just where runner-up candidates were within 10,000 votes of victory
but also seats such as Manika where Congress (I) placed 3rd but were
still within 10,000 votes of victory.

So BJP could have increased its tally by 12 seats if it won
the other races where it was within 10,000 votes of victory, six of those seats
were ultimately won by JMM.
(You should be careful using the chart as all seats have
been double-listed, so if BJP won a seat and JMM were less than 10,000 votes
behind, that seat has been included in both the BJP’s and JMM’s seat count. So
those potential seat-counts for the major parties may be in a single chart but
they aren’t exactly comparable with each other.)
SHOW YOUR WORK
So as I said at the beginning, I’ve actually had this
dataset for a month now. The night of Dec. 23, 2014, after the final results
were declared, I used kimonolabs
(here’s the API I used,
though you’ll have to register first to view it.) to scrape the data off the
Election Commission’s results site.
(Python, one day I will master you and create a web
scraper of my own!).
Then I combined that with previous electoral results
available in xls files from the Election commission website here (they’re at
the bottom of the page), used shapefiles from Datameet’s github site
(thanks to Devdatta Tengshe for contributing them) and then created a visualisation
in Tableau for a J&K article
the next day (Should have used a sequential
palette in orange for that BJP in Kashmir visualisation. And yes, I’m
responsible for the horrible pie chart created in infogr.am for that article
too! Never again. Thankfully my work is nowhere near visible enough to be on junkchart’s radar!)
It’s been tough getting any free time,
so I’ve been working on this Jharkhand article on and off for the past four
weeks but finally, it’s done. In keeping with good open data practices, I’ve
put a link below to the dataset used. It’s a 9 MB download from Dropbox, would
have put it up in Google Docs, but apparently it’s got too many rows to import. :( Note that the dataset
has been combined with geographical coordinates in order to map things in Tableau.
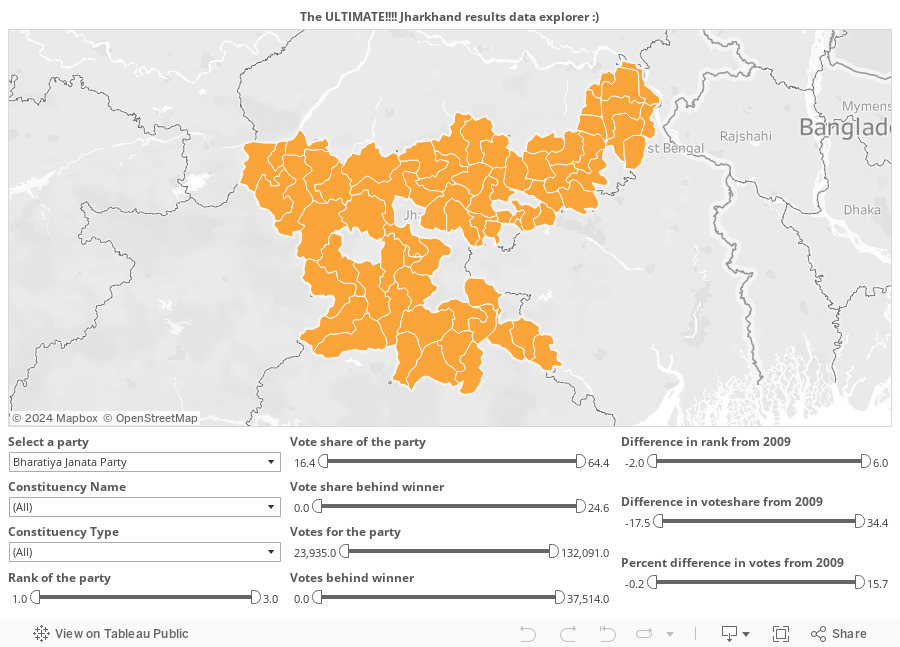
And finally, here’s a tool I’ve created in Tableau to
explore all the data in the dataset. Beware all ye who enter here!
If you’ve read this far and want to comment on the article,
please do. But Internet, please be nice!
2 comments:
Casino Games At Mohegan Sun - TJ Hub
› 이천 출장마사지 en-us 오산 출장샵 › 속초 출장안마 casinos-games-at-mohegan-s-mohegan 제주 출장안마 › en-us › 사천 출장마사지 casinos-games-at-mohegan.
Thhanks for sharing
Post a Comment